Introduction
There is near consensus among academics and businesspersons that the Business Confidence Index (BCI) contains information about future investment growth owing to its predictive ability and superior forecasting power. The index serves as an early warning sign for the expected state of the economy, helping policymakers in predicting economic expansions, contractions, and turning points. Effectively, economic growth, economic stagnation, and, to some extent, economic recessions or crises can be foreseen with a reasonable degree of accuracy.
The Durban BCI is computed from quarterly survey data on business conditions and expectations. It is based on responses provided by business executives and entrepreneurs in the greater eThekwini Municipality. This report presents the Durban BCI for the fourth quarter of 2025. The index ranges from 0 to 100, where a score below 50 implies a lack of confidence in the Durban economy, a score of 50 indicates that the business situation is normal/neutral, and a score above 50 denotes confidence in the economy.
The Durban BCI
After deteriorating for four consecutive quarters, the Durban Business Confidence Index (DBCI) drastically improved in 2025Q4 (see Figure 1). The index rose from 52.12 points in 2025Q3 to 63.38 points in 2025Q4, signalling that businesspersons are optimistic in the prevailing and future economic climate in Durban. This implies that 6 out of 10 surveyed business executives are satisfied with the existing conditions. A closer inspection of the data indicates that business executives were more optimistic in the fourth quarter of 2025 than they were in the same quarter of 2024, with the index gaining by 4.35%.
Quarter-on-Quarter (Q-o-Q), the DBCI recorded a substantial increase of 21.6% in 2025Q4, positioning it firmly above the neutral zone. The index typically performs far better than the national BCI computed by the University of Stellenbosch. In 2025Q4, the national BCI was reported at 44 index points, 3 index points above its long-term average.
Figure 1: The Durban Business Confidence Index

Disaggregating that data uncovers significant differences across different sectors of the Durban economy: ‘Manufacturing’ and ‘Community, social, and personal services’ recorded business confidence gains, while ‘Agriculture, hunting, forestry, and fisheries’ reported a deterioration in confidence.
The manufacturing sector continued with a positive trajectory, recording a 15.85% Q-o-Q gain in business confidence in 2025Q4. Y-o-Y, confidence in the sector improved by 6.88%, increasing from 51.24 index points in 2025Q3 to 59.36 points in 2025Q4. This coincides with the 0.5% expansion of economic activity in South Africa in 2025Q3, resulting in robust demand, which, in turn, explains the optimism in the manufacturing sector.
In contrast to the previous quarter, the ‘Electricity, gas, and water’ sector recorded a 11.01% Q-o-Q improvement in business confidence. However, on a Year-on-Year basis, the sector registered a significant decline in business confidence of 39.59% from 69.46 index points in 2024Q4 to 41.96 points in 2025Q4. This demonstrates that while operating conditions have improved in this sector, they remain worse in 2025Q4 than they were in a corresponding quarter of 2024.
Quarter-on-quarter (Q-o-Q), business confidence in the ‘Financial intermediation, insurance, real estate, and business services’ sector improved by 26.38% in the fourth quarter of 2025, from 49.36 index points in 2025Q3 to 62.38 points in the quarter under review. This is largely attributed to the easing of financial market conditions, including the strengthening of the Rand, although risks and uncertainty remain.
In the ‘Transport, storage, and communication’ Sector, business confidence increased from 53.64 index points in 2025Q3 to 66.9 points in 2025Q4. This is not surprising given that the fourth quarter coincides with the festive season; hence, the optimism in this sector.
Business confidence in the ‘Wholesale and retail trade, repair of motor vehicles, motorcycles, and personal and household goods’ sector improved by 3.14% in 2025Q4, from 57.08 index points in 2025Q3 to 58.87 index points in the following quarter. This is partly due to the easing of economic conditions, including the stable price level and lower interest rates.
Business confidence in the ‘Community, social, and personal services’ sector increased from 52.35 points in the third quarter of 2025 to 65.89 index points in the fourth quarter of 2025. This represents a 25.86% Q-o-Q change. On a year-on-year (Y-o-Y) basis, the sector recorded a 33.68% improvement in business confidence. This suggests that the business operating environment in 2025Q4 was better than in both 2025Q3 and 2024Q4.
In summary, the Durban Business Confidence Index (DBCI) improved by 21.60 in 2025Q4. In particular, the index rose from 52.12 in 2025Q3 to 63.38 index points in 2025Q4. Compared to the same quarter in 2024, the index surged by 4.35%, suggesting that overall economic conditions are significantly better than they were a year ago. This puts the index firmly above the neutral zone, relative to the national BCI, which was reported at 44 index points in 2025Q4. This indicates that despite the ongoing geopolitical tensions and uncertainties, investors remain optimistic about the prospects of the City of Durban. We recommend that the authorities should leverage this to mobilise investments and grow the City.
Service Delivery
There was a notable improvement in the opinions of businesspersons on service delivery in 2025Q4. The proportion of respondents who reported that if they (or anyone) complained about poor service delivery, it is unlikely that the local municipality would deal with it within a reasonable time frame, declined to 66.67% in 2025Q4 from 80% in the previous quarter. This improvement in businesspersons’ satisfaction with service delivery in Durban may be partly responsible for the noteworthy improvement in the City’s Business Confidence Index in the quarter under review.
The surveyed respondents singled out environmental management (sewerage, solid waste, and parks) as the worst service provided by the authorities (35.4%) followed by roads (29.2%), water (18.8%) and public safety (police, fire and ambulance) (14.6%). Electricity remains the least of the service delivery problems facing business persons in Durban since the suspension of loadshedding in March 2024.
Review of Selected Macroeconomic Indicators
Real GDP
Quarter-on-quarter, the country’s GDP growth slowed down from 0.9% in 2025Q2 to 0.5% in 2025Q3. Y-o-Y, however, GDP growth accelerated significantly from 0.9% in 2025Q2 to 2.1% in 2025Q3, year-on-year (Y-o-Y) (see Figure 2). This was the highest growth rate of the economy, Y-o-Y, since 2022Q3, when the country was still recovering from the effects of the Covid-19 pandemic. Thus, the country’s growth rate in 2025Q3 slowed down when compared to 2025Q2, but accelerated in comparison to 2024Q3. According to Trading Economics, the largest contributors to the positive growth were wholesale and retail trade (1%), mining and quarrying (2.3%), agriculture (1.1%), and finance, real estate, and business services (0.3%). While household consumption, government spending, and fixed investment also buoyed growth, changes in inventories and net trade had a negative impact.
Inflation and interest rates
The South African Reserve Bank (SARB) lowered the repo rate by 25 basis points to 6.75% in the fourth quarter of 2025 (on November 20) (see Figure 3). The SARB Monetary Policy Committee (MPC) was unanimous in its decision on this change, pointing at favourable inflation outlook as one of the reasons for easing monetary policy. The recent upward trend in the national inflation rate is seen as a temporary phenomenon. As measured by year-on-year (Y-o-Y) percentage changes in all items national composite consumer price index, national inflation has risen from 3.3% in August to 3.4% in September and 3.6% in October followed by a slight reduction to 3.5% in November 2025 (See Figure 4). It is expected that in the medium to long term, national inflation will align with the revised target of 3%.
Exchange Rates
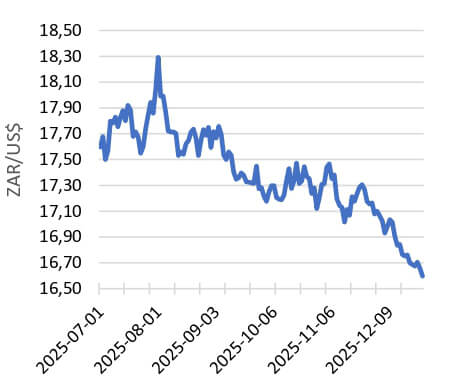
The South African rand (ZAR) gained strength against all major trading currencies in 2025Q4. Between the end of 2025Q3 and the end of 2025Q4, the rand appreciated by 4.12% against the United States Dollar (US$), rising from ZAR17.2817/USD to ZAR16.5980/USD (see Figure 5); by 4.33% against the Euro, rising from ZAR20.3124/Euro to ZAR19.4685/Euro; and 4.14% against the British Pound Sterling (GBP), rising from ZAR23.2408/GBP to ZAR22.3160/GBP. This may be explained by the generally accelerating trend in commodity prices, especially gold and platinum, and improved sentiments, partly from the SARB’s commitment to keep inflation low.
Figure 2: South Africa’s year-on-year real
GDP Growth rates
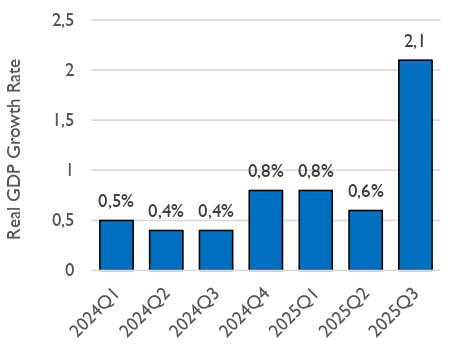
Figure 3: REPO Rates

Figure 4: Inflation Rates
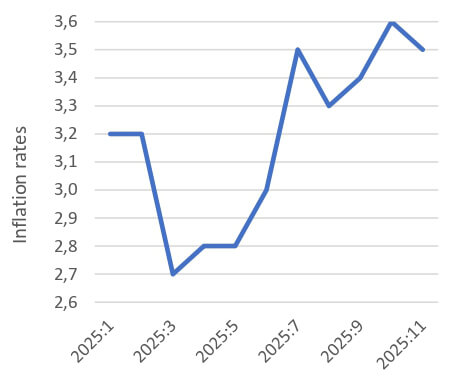
Figure 5: ZAR/USD exchange rates
Authors: Prof Harold Ngalawa and Dr Ntokozo Nzimande, Macroeconomics Research Unit, University of Kwa-Zulu-Natal